Pivot tables
Why pivot tables work well with Frame
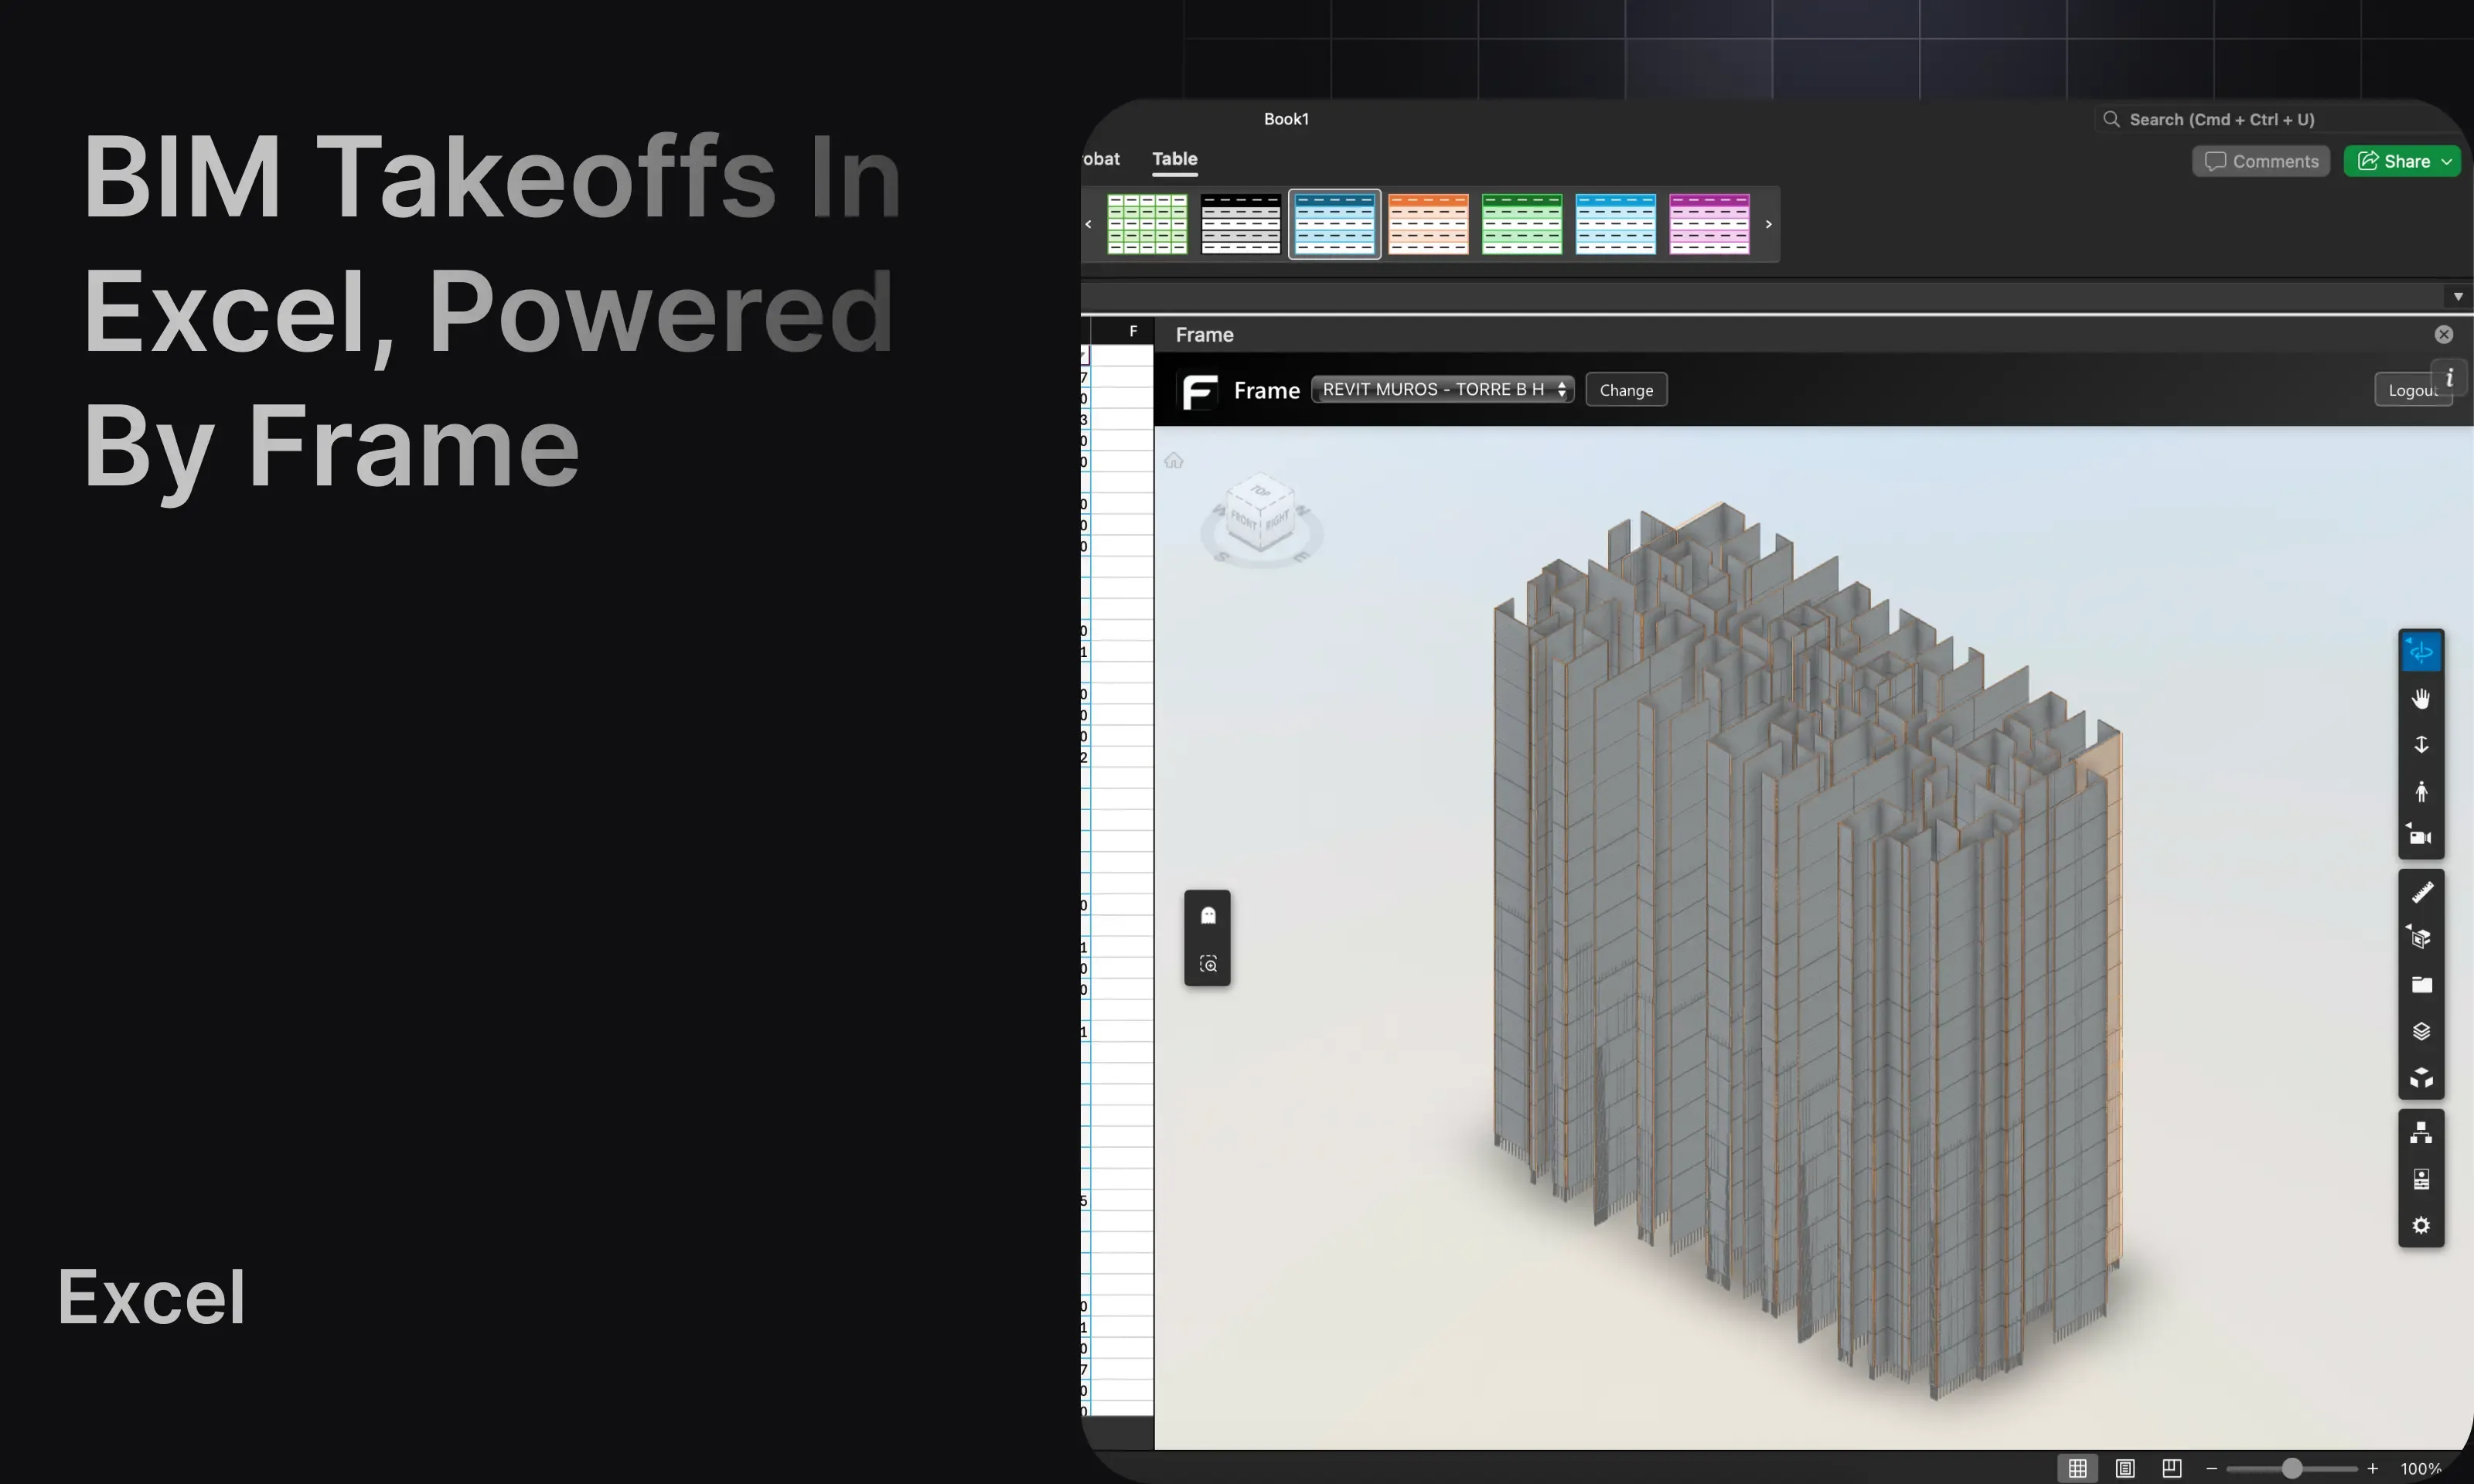
Section titled “Why pivot tables work well with Frame”Pivot tables stay useful because they let teams summarize BIM data quickly without giving up Excel. Frame improves that workflow by keeping the summary connected to the model context.
Recommended approach
Section titled “Recommended approach”Start by exporting model properties and reducing the dataset to the fields that matter. Then build the pivot table from that filtered flat table instead of throwing every available property into the pivot from the start.
This gives you:
- less noise
- better workbook performance
- more control over the fields used in analysis
- easier interpretation for estimators and project teams
Common pivot examples
Section titled “Common pivot examples”- areas by level
- quantities by type name
- volumes by assembly code
- counts by family or category
Validate the summary in 3D
Section titled “Validate the summary in 3D”After building the pivot:
- Select the row or group you want to validate.
- Use the Excel-to-Viewer interaction.
- Confirm the highlighted geometry matches the summary you are reviewing.
This is especially useful for takeoffs because the pivot shows the number and the viewer proves the scope.
Walkthrough video
Section titled “Walkthrough video”Next step
Section titled “Next step”If your workbook needs to survive model revisions, continue to Refresh tables.