Quantities template
When to use Quantities
Section titled “When to use Quantities”Use Quantities when you need takeoffs or quantity-focused reporting for elements such as walls, floors, columns, beams, and other model objects.
Configure the report in Frame
Section titled “Configure the report in Frame”When you create the report, Frame opens dialogs for three choices:
- Element Filter: choose the type of elements you want to analyze.
- Properties to Analyze: choose the quantities or properties you need, such as area, volume, length, name, or type.
- Color Code: choose the parameter used to color elements in the 3D viewer.
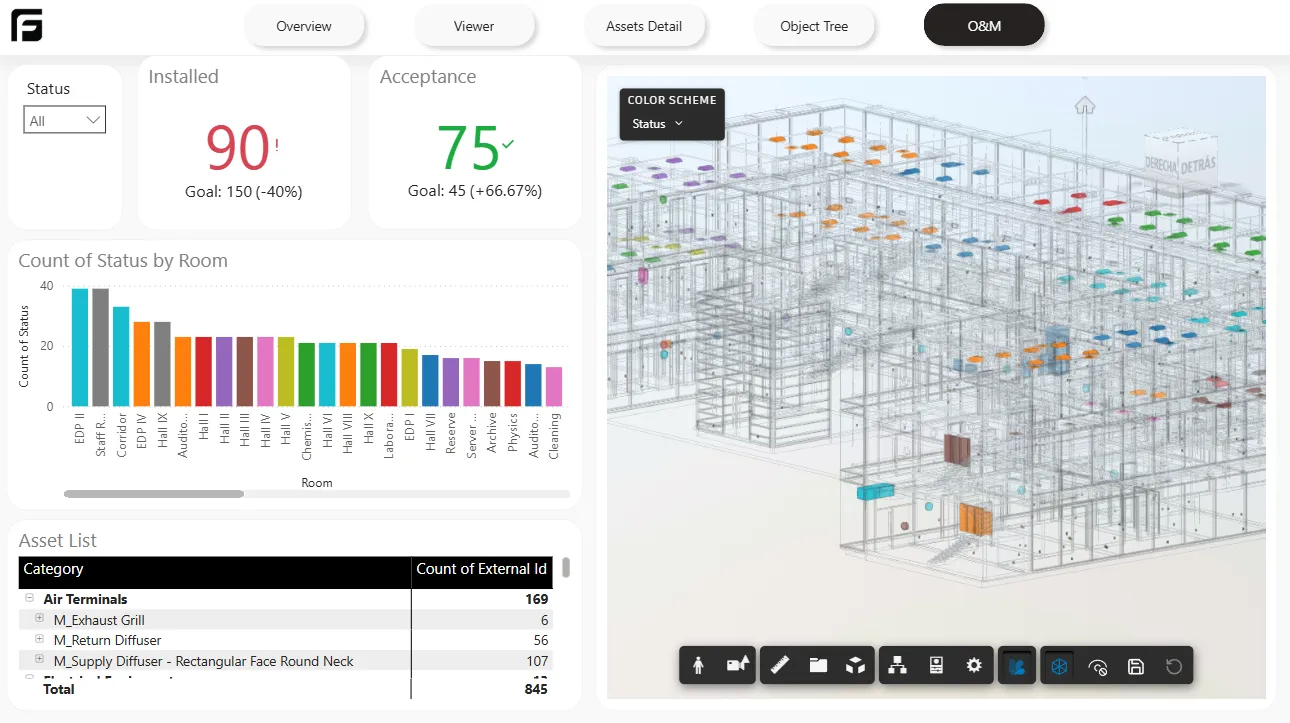
Power BI setup
Section titled “Power BI setup”The downloaded report includes five tabs. The first four are the same as the Starter template. The fifth tab is Takeoff, and that is where you make the quantity-specific adjustments.
1. Add unpivot values
Section titled “1. Add unpivot values”From the Take Off unpivot table, drag the values you selected when downloading the report. They appear individually on the right side of Power BI. Add them to the table visual to see the results.
2. Configure the bar chart
Section titled “2. Configure the bar chart”Place the value you chose for coloring on both axes, X and Y. In the visual settings, open Columns, change Color to Field value, and select the Color Code value from the Take Off unpivot table.
3. Activate viewer colors
Section titled “3. Activate viewer colors”Select the Frame visual and drag the Color Code column from the data pane into it. That enables the 3D viewer colors based on the selected property.
Typical use cases
Section titled “Typical use cases”- takeoff review
- quantity validation
- property-based comparisons
- color-coded model analysis
Next step
Section titled “Next step”For the full catalog and page summaries, see Power BI templates.